Ed’s Note: This is an extract from the book Beginning Microsoft SQL Server 2012 Programing by Paul Atkinson and Robert Vieira copyright John Wiley & Sons 2012. For Source Code, Sample Chapters, the Author Forum and other resources, go to the book’s homepage on wrox.com

Building Your First Cube
You can get a feel for what it takes to use SQL Server Analysis Services by building a cube based on the AdventureWorks data warehouse. Once you’ve had a chance to poke around there, you can take a look at some of the other ways of providing BI reporting.
NOTE: For this example, you’ll be working within the SQL Server Data Tools, or SSDT. Note that SSDT is entirely different from the SQL Server Management Studio that you’ve been mostly working with thus far. The SQL Server Data Tools is a different work area that is highly developer- (rather than administrator-) focused; indeed, it is a form of Visual Studio that just has project templates oriented around many of the “extra” services that SQL Server offers. In addition to the work you’ll do with SSDT in this chapter, you will also visit it some to work with Reporting Services, Integration Services, and more Analysis Services in the chapters ahead.
Try It Out: Creating an SSAS Project in SSDT
This is one of the most advanced examples in the book, so get ready for some fun. You’ll build a cube in SSAS, which gives you high-speed multidimensional analysis capability. This one will use UDM, but you’ll get a chance to use BISM in a little bit. Building your cube will require several steps: You’ll need to build a data source, a data source view, some dimensions, and some measures before your cube can be realized.
Start a New Project
To build an SSAS cube, you must first start a project by following these steps:
- Open the SQL Server Data Tools and create a new project.
- In the New Project dialog box under Installed Templates on the left, choose Business Intelligence Analysis Services.
In the main pane, select Analysis Services Multidimensional and Data Mining Project, as you can see in Figure 18-2.
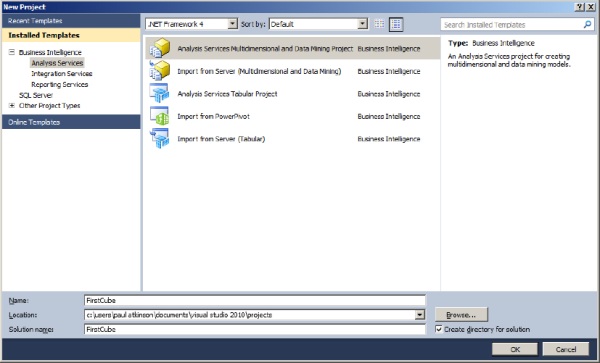
Figure 18-2. The New Project dialog with Analysis Services Multidimensional and Data Mining Project selected
- 4. Name your project FirstCube and click OK.
You’re now presented with an empty window, which seems like a rare beginning to a project with a template; really, you have nothing to start with, so it’s time to start creating. The first component you’ll need is somewhere to retrieve data from: a data source.
Building a Data Source
To create the data source you’ll use for your first cube, follow these steps:
- Navigate to the Solution Explorer pane on the right, right-click Data Sources, and click New Data Source. This will bring up the Data Source Wizard, which will walk you through the creation process just as you’d expect.
- Before you skip by the opening screen as you usually would, though, take note of what it says (just this once. . .you can skip it later). I won’t re-type it here, but it’s giving you a heads-up about the next component you’ll create: the data source view.
- Meanwhile, go ahead and click Next to continue creating your data source. In this next screen, it’s time to set up a connection string.
- If your AdventureWorksDW database is visible as a selection already, go ahead and choose it; if not, click New.
- For your server name, enter (local), and then drop down the box labeled Select or Enter a Database Name and choose AdventureWorksDW.
- Click OK to return to the wizard and then click Next.
- You can now enter the user you want SSAS to impersonate when it connects to this data source. Select Use the Service Account and click Next. Using the service account (the account that runs the SQL Server Analysis Server service) is fairly common even in production, but make sure that service account has privileges to read your data source.
- For your data source name, type AdventureWorksDW and then click Finish.
Building a Data Source View
Now that you’ve created a data source, you’ll need a data source view (as the Data Source Wizard suggested). Follow these steps:
- Right-click Data Source Views and choose New Data Source View. Predictably, up comes the Data Source View Wizard to walk you through the process. Click Next.
- Make sure the AdventureWorksDW data source is selected and then click Next.
- On the Select Tables and Views screen, choose FactInternetSales under Available objects and then click the right arrow to move it into the Included Objects column on the right.
To add its related dimensions, click the Add Related Tables button as shown in Figure 18-3 and then click Next. Note that one of the related tables is a fact, not a dimension. There’s no distinction made at this level. Later, you will be able to select and edit dimensions individually.
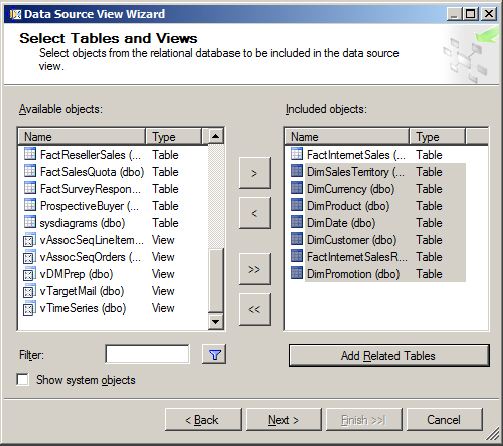
Figure 18-3. Adding tables to the view
- On the last screen, name your data source view according to its contents: Internet Sales.
Click Finish to create the Internet Sales data source view, and you’ll see it in the content pane, looking something like Figure 18-4 (your exact layout may vary).
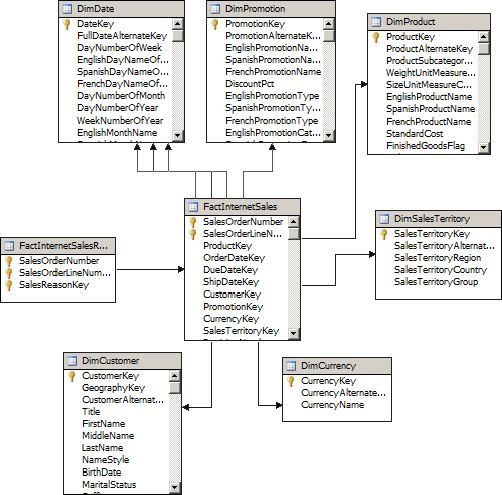
Figure 18-4. The finished Internet Sales view
Creating Your First Cube
Now for the exciting part…you get to create your first cube.
- Right-click Cubes in the Solution Explorer and select New Cube to bring up the Cube Wizard. This will walk you through choosing measure groups (which you currently know as fact tables), the measures within them, and your dimensions for this cube. Don’t worry about the word “cube” here and think you just have to stick with three dimensions, either; cube is just a metaphor, and you can create a four-dimensional hypercube, a tesseract, or an unnamed higher-dimensional object if you want (and you’re about to do so!). To begin, click Next.
- On the Select Creation Method screen, make sure Use Existing Tables is selected, and click Next.
The wizard will now want you to tell it where to find measure groups. You could help it out by telling it those are in your fact tables, but never mind — it’s smart enough to figure it out. If you click Suggest, it will automatically select the correct tables. Do so (the result is shown in Figure 18-5) and then click Next.
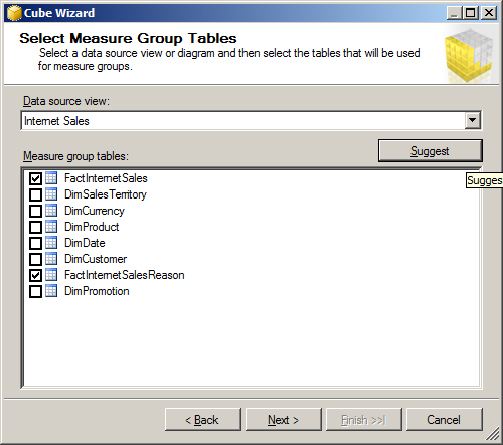
Figure 18-5. Selecting Measure Group Tables
- Now the wizard would like to know which measures from your measure groups (fact tables) you’d like to store in the cube. By default it’s got them all selected; go ahead and accept this by clicking Next.
- At this point, you have measures, but you still need dimensions; the wizard will select the dimension tables from your data source view and invite you to create them as new dimensions in the UDM. Again, by default they’re all selected, and you can click Next.
The wizard is now ready to complete. Verify you have something that looks like Figure 18-6, and go back to make corrections if you need. If everything appears to be in order, click Finish.
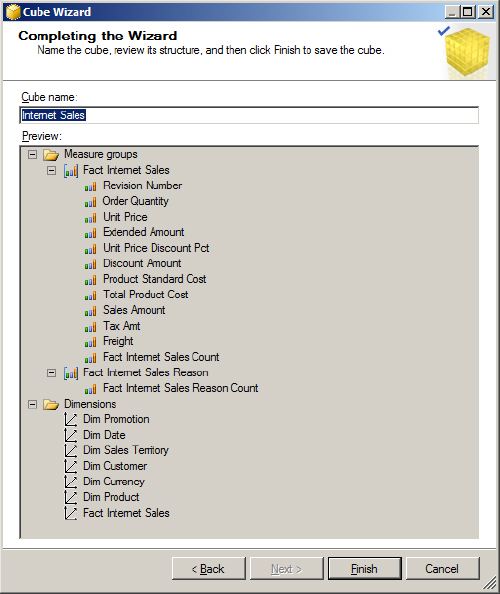
Figure 18-6. Completing the Cube Wizard
Making Your Cube User-Friendly
Right about now, you’re probably expecting something like “congratulations, you’re done!” After all, you’ve built up the connection, designated the measures and dimensions, and defined your cube, so it would be nifty if you could just start browsing it, but you’re not quite there yet. First you’ll want to make some of your dimensions a little more friendly; they’re currently just defined by their keys because SSAS doesn’t know which fields in your dimension tables to use as labels. Once you’ve settled that, you’ll need to deploy and process your cube for the first time before it’s ready to use.
- In the Solution Explorer under Dimensions, double-click DimDate. The Dimension Editor will come up, allowing you to make this dimension a bit more useable.
- To make the date attributes available, highlight all of them (except DateKey, which as you can see is already in the attribute list) and drag them to the attribute list.
- Date, of course, is a dimension that can be naturally defined as a hierarchy (like you did quite manually in the T-SQL grouping examples). Drag Fiscal Quarter from the Attributes pane to the Hierarchies pane to start creating a hierarchy.
- Drag Month Number of Year to the
tag under Fiscal Quarter, and DateKey similarly below that. Finally, rename the hierarchy (right-click it and choose Rename) to Fiscal Quarter - Month. The result should look something like Figure 18-7.
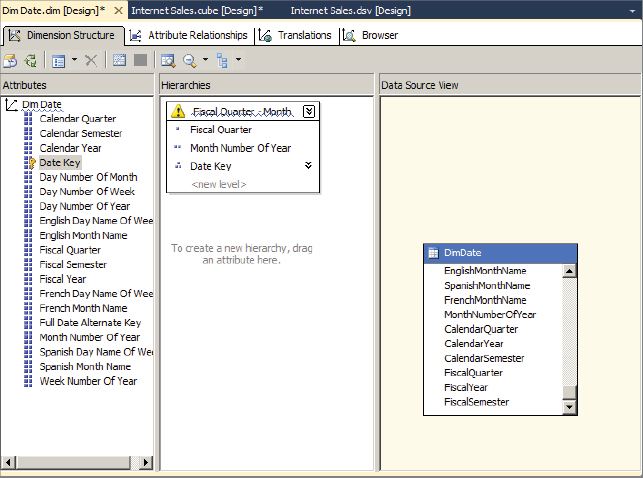
Figure 18-7. Renaming The Hierarchy
- Save the DimDate dimension and close the dimension editor. You will be prompted to save changes to your cube along with the new dimension changes; do so.
- For each of the other dimensions, don’t create hierarchies for now, but bring all the interesting text columns into the Attributes pane (you can bring over all the non-key columns except for the Large Photo column in the Products table), and re-save the dimensions.
Deploying the Cube
There’s more you can do to create useful hierarchies, but for now it’s time to build, deploy, and process the cube. This process can be started by following these steps.
- Select Deploy First Cube on the Build menu. You’ll see a series of status messages as the cube is built, deployed, and processed for the first time. You’ll receive a few warnings when you deploy FirstCube, and if they’re warnings and not errors, you can safely ignore them for now.
- When it’s done and you see Deployment Completed Successfully in the lower right, your first cube is ready to browse.
NOTE When you set up a user in your data source view, you chose the service user — this is the user that’s running the Analysis Services service. If that user doesn’t have a login to your SQL Server, you’re going to receive an error when you try to process your cube.
In addition, this example bypasses a step that’s important for processing hierarchies in cubes with large amounts of data: creating attribute relationships. The cube will still successfully process (though you will receive a warning), and for the data volumes in the AdventureWorksDW database it will perform adequately. For larger data volumes, you will need to address this warning. For more information on how to do that, consult the more complete SSAS text.
- In the Solution Explorer pane, double-click the Internet Sales cube and then look in the tabs above the main editing pane for the Browser tab and click that.
- Now you can drag and drop your measures (such as ExtendedAmount) and your dimensions and hierarchies (look for the Fiscal Quarter - Month hierarchy under the Due Date dimension) into the query pane, and voilà — your data is sliced and diced as quickly as you please.
How It Works
Whew! That was a lot of setup, but the payoff is pretty good too. What you’ve done is to build your first cube, and under the hood you’ve created a UDM-based semantic model queryable through the MDX language. This cube isn’t fully complete — you’d probably want to add some aggregations, attribute relationships, and other elements, but it’s an impressive start.
It started when you chose your project type. The Multidimensional project types build the UDM-based data models, whereas the Tabular Project types build your model in BISM. Because I plan to bring you through PowerPivot shortly (which is BISM-based), I led you down the UDM route here. You’ll find that for basic operations the two are equally capable.
Once you had your project put together, you had a few components to create on the way to browsing your cube. Let’s call a few out.
- Data source: Your data source is a connection to an individual place where data for your BI reporting can be found. While this one was a SQL Server data source, you can use any number of providers, both included and third-party. Nothing here should surprise you too much; this is a similar kind of list to what you’d find in SSIS, for example.
- Data source views: A data source view is a much more interesting animal. Using a data source, the data source view contains a set of tables or views, and defines the relationships among them. Each DSV is usually built around a business topic, and contains any tables related to that topic.
- Cubes: While the next thing you proceeded to create was a cube, the Cube Wizard went ahead and built measure groups and dimensions for you along the way. Without those, you haven’t got much of a cube. The cube isn’t a pass-through directly to your source data. To update the data in the cube, you must process the cube; you can do this through a regularly scheduled job with SQL Agent or, of course, manually. In this case, the wizard took care of a lot of the details for you, but you’ll read more about what the cube really is in a few minutes.

Comments