The performance of your code can almost always be improved. A (grossly oversimplified) summary of Amdahl’s law says that you should focus your effort on optimisations that will affect the greatest possible portion of the program.
A profiling tool gathers data about an executing application, for instance function timings, in order to measure its performance and find problem areas or ‘hotspots’. There are two main approaches to profiling – sampling and probing (also known as instrumentation). Each approach has its trade-offs.
A sampling profiler takes statistical samples of an application as it runs. At predefined intervals or upon certain events it takes a snapshot of what’s executing, and thus provides an aggregate feel for performance and problem areas rather than an exact picture. On the upside, sampling is fairly unobtrusive to the application as it executes, and is relatively low overhead in terms of the amount of data it gathers.
A probing profiler relies on an application being instrumented before it is executed. This means that probes (or hooks) are injected into the application to collect information, often at function entry and exit. Probing does produce much higher fidelity information than sampling, capturing exact details of the performance characteristics of the application and building a full picture that allows performance problems to be pinpointed. On the downside, probing is more obtrusive to the application and is higher overhead in terms of the amount of data it gathers.
Either technique is perfectly valid, and often both are used to complement each other; sampling is used to get general application performance characteristics and to indicate problem areas, and probing is used to pinpoint specific problems in order to fix them.
Visual Studio 2005 profiler tool
Visual Studio 2005 Developer and Team editions have a built-in code profiling tool – based on profiling tools used internally at Microsoft – which supports both sampling and instrumentation (probing) profiling modes. Once profiling options have been chosen and profiling is complete, various analysis views are available to examine the collected profiling data and help isolate performance problems. The profiler operates on native and managed code so, for example, ASP.NET, Windows Forms, MFC or Win32 Services code can be profiled using the same techniques. Even though it integrates seamlessly with Visual Studio 2005, the profiler can also be used outside the Visual Studio 2005 environment in cases where that makes sense, e.g. profiling Windows services. This article will deal with the basics of profiling a console application within Visual Studio.Performance sessions
The characteristics of a particular profiling run are captured in a performance session. The performance session contains information about whether sampling or instrumentation mode is used, which assemblies are to be profiled, plus several other options explored later. There are several ways to create a performance session. One of the easiest is to use the Tools–>Performance menu option, see Figure 1, which can be used to either create a blank performance session, or to create a performance session configured via a performance session setup wizard.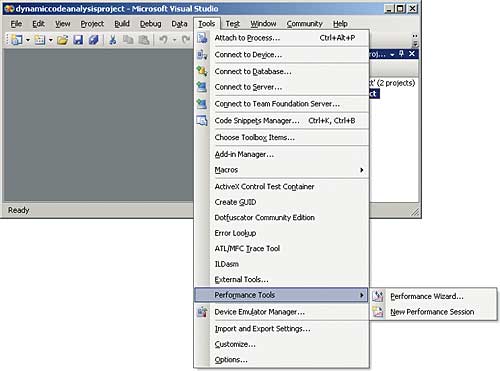
Figure 1: Creating a performance session
Performance session details are stored in a file with a .psess extension which can be viewed via the Performance Explorer, available from the View–>Other Windows–>Performance Explorer menu item. The Performance Explorer, shown in Figure 2, can be used to create, delete, manage and execute performance sessions.
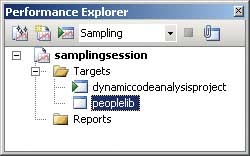
Figure 2: The Performance Explorer
The Targets folder contains the assemblies to be profiled. In fact, in sampling mode, data is collected from all binaries running, and only in instrumentation mode can data can be collected from specific binaries. As a general rule, it’s best to limit the number of instrumented binaries to keep from being overwhelmed with data. The assembly with the green arrow icon (dynamiccodeanalysisproject, in this case) is the executable that runs when the performance session is launched. The Reports folder will contain the performance report once the performance session has been launched and has run to completion.
Performance session properties
Performance session properties can be changed and fine-tuned after the performance session has been created by right-clicking on the performance session and selecting the Properties menu item to reveal the dialog in Figure 3.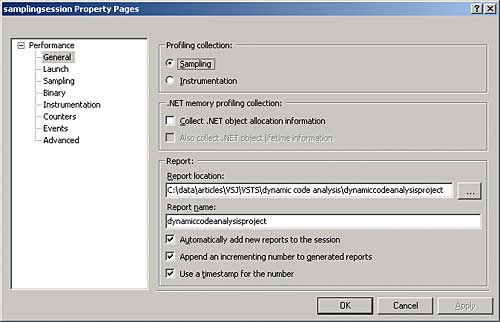
Figure 3: Fine-tuning performance session properties
A good tip is to create a different performance session for every unique profile configuration rather than keep changing the settings of the same performance session. Also, give their corresponding reports meaningful names (or put them in meaningfully named directories). That way you can easily distinguish different profile runs, and it makes it easier to analyse before and after scenarios to see the impact of the code changes you’re making.
The first decision to make is what mode to run the profiler in, and much of the other configuration follows on from that. As mentioned before, it is generally wise to start profiling the application in sampling mode as it will intrude less on the application and collect less data. Hopefully, sampling will indicate where problems lie and narrow down the focus, thus reducing the number of binaries that will need to be profiled in instrumentation mode in order to fix the hotspots.
Configuring a performance session for sampling
Once sampling mode has been selected it is possible to change the trigger and threshold settings that determine when a sample is taken. The default is to sample every 10 million clock cycles, but samples can also be taken upon page faults, system calls and certain performance counters. If the application is using lots of memory, you can choose to sample on page faults, in which case the performance snapshots will be taken when pages are being swapped out of RAM, and it is possible to see what component was responsible. If initial profiling indicates that a great deal of time is being spent in areas outside your code, it is possible to sample on system calls instead (transitioning from user mode to kernel mode). This way it is possible to locate threads that are potentially blocking on kernel objects more than necessary.Sampling using clock cycles is probably what will almost always be used. Remember that sampling less frequently than the default, which you may do to lessen the impact of sampling, means the application needs to be run for longer to get a good distribution of samples across the hot spots. Having said that, with sampling it is possible to get a statistically significant number of samples quicker than you may think!
Launching a profile run and analysing the results
Once the performance session properties for sampling are set it is time to launch a profiler run. Make sure you have set your configuration to “Release” before doing this as performance data from debug builds may be less than useful. To launch the profiler run, select the performance session in Performance Explorer and select the “Launch” menu item. This will start the process indicated by the icon with the green arrow in the Targets folder. In the Visual Studio Output window you will see the profiler start and attach to the process and then the process will exit and the profiler will stop. When the profiler run is complete, a .vsp file is created that contains raw performance data. The analysis is done when you open up the file and may take some time if the amount of performance data is large. Now it is a question of analysing the profiling reports to understanding what they are telling you.The first report view you will be presented with is the “Summary” view shown in Figure 4.
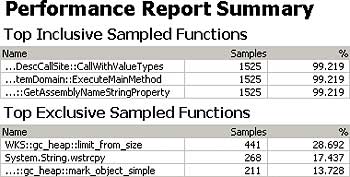
Figure 4: The initial summary report
As mentioned before, sampling takes place across the whole application. Much of the work goes on inside the Framework Class Library or the operating system. If you see one of your methods in the summary view, you may be looking at a performance problem.
The more often a function appears in the call stack (Inclusive Sampled), the more time that function is spending in execution, so that’s one place where you want to focus your attention for tuning. If you are seeing functions from your code in the “Top Inclusive Sampled Functions” list then you’d better understand why that function takes so long to execute. The more often a function appears at the top of the call stack (Exclusive Sampled) the more frequently that function is being called – maybe too often – so that’s another place to look (even though the execution of the function may actually be quite fast). If you are seeing functions from your code in the “Top Exclusive Sampled Functions” list then you’d better understand why you are calling that particular function so often.
In this case, it turns out that none of my code appears in either list. However, some memory management code and string handling code does seem to have been called fairly often. This may be food for thought. If this summary report view provides insufficient information, there are other report views that can be used. For instance we could look at the “Functions” report view to get more information as shown in Figure 5. This might lead one to believe that an inordinate amount of time is being spent in the PeopleHelper.GetPeopleAsStringList() method.
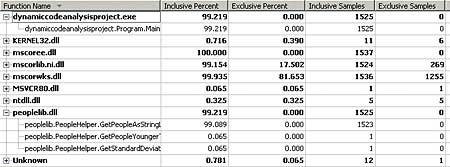
Figure 5: Exploring the functions report
There are other views available. A function “Caller/Callee” report view shows which functions are called by (and being called by) which, and a function “Call Tree” report view defines a tree view showing which functions called which. It transpires that, in sampling mode, the profiler does a fast stack walk to provide call stack information – rather than just grabbing the currently executing instruction – and this makes it straightforward to determine parent-child method relationships and easier to establish the worst performing code paths. This is unusual for a sampling profiler.
Memory profiling
In situations where you have a feeling that excessive memory is being allocated, or memory is not being released appropriately, then you can perform .NET memory allocation profiling. The object “Allocation” and “Lifetime” report views then tell you how many objects were allocated, how big they were and how long they lived. The first performance session wasn’t configured to profile memory so those views are empty.Given that there was a suspicion after the last profile run that there were some memory-related functions being called fairly often, it would make sense to create another performance session that samples and collects memory usage information. A new performance session can be created from the toolbar of the Performance Explorer window. Once created, go to the new performance session’s properties and check the “Collect .NET object allocation information” and “Also collect .NET object lifetime information” options on the “General” tab. After launching the performance session the resulting “Summary” report view looks like the one shown in Figure 6.
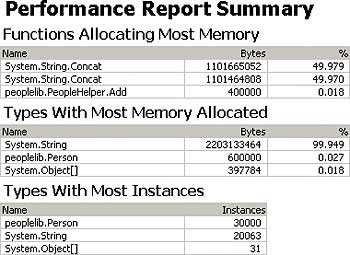
Figure 6: More summary information
This shows that far too many String and Person instances are being created. The object “Allocation” and “Lifetime” report views are now populated with lots of useful information. These confirm the excessive memory allocation and shows instances were only allocated for a short period of time. The “Functions” report view also pinpoints the main function culprits as coming from the PeopleHelper class. Figure 7 illustrates the relevant section of the object “Allocation”, object “Lifetime” and “Functions” report views.
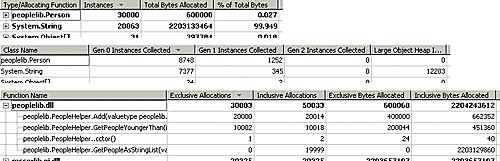
Figure 7: Reports reveal problem areas
Now would be a good time to home in on the peoplelib assembly and profile it in instrumentation mode. Creating another new performance session to do this is the correct approach.
Configuring a performance session for instrumentation
In instrumentation mode, it is also possible to change the trigger settings that determine when data is collected. As well as collecting data upon function calls, data can also be collected upon performance counters and Event Tracing for Windows (ETW) events. Remember that binaries must be instrumented before the profiler runs in instrumentation mode. The default is to instrument them in place, saving the originals, but a particular location can be specified for instrumented binaries. You can also specify programs you want to run before and after instrumentation takes place. This can be useful for, say, moving an instrumented binary into the GAC or to a specific location on the Web server. Also, because instrumenting a signed assembly invalidates the signature, it is necessary to re-sign the assembly in the post-instrumentation step if you want to subsequently run it (assuming signature verification has not been turned off).Launching the new performance session reveals the “Summary” report view shown in Figure 8.
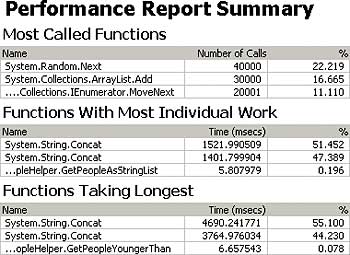
Figure 8: Instrumentation summary report
Again, if you are seeing functions from your own code in any of these lists – “Most Called Functions”, “Functions With Most Individual Work” (time spent exclusively in that function) or “Functions Taking Longest” (time spent in that function and its sub-functions) – then you’d better understand why. This is the final nail in the coffin for the PeopleHelper class in general and its GetPeopleAsStringList() method in particular. Although it is also possible to collect .NET memory allocation and lifetime information in instrumentation mode there is probably not much point in this case as the main suspects have already been identified. Before fixing the problems with the code, there are a few things that you should bear in mind when looking at some of the other report views from an instrumentation profile run.
The “Call Tree” report view for an instrumented profile run may look slightly different from its sampling counterpart. Remember that profiling only takes place in those binaries that were instrumented. It is only possible to get timing information for methods in instrumented binaries, as well as for the length of the calls made to methods in non-instrumented binaries, but it is not possible to get any detail into the methods in the non-instrumented binaries. The reason is that, in an instrumented binary, probe points are added to the entry/exit point of each function and around any call site that is external to the instrumented binary.
The “Functions”, “Caller/callee” and “Call Tree” report views refer to “Exclusive” and “Inclusive” time, “Elapsed” time and “Application” time. Exclusive time is the amount of execution time that passed while within that function excluding the time spent in functions called from that function. Inclusive time is the amount of execution time that passed while within that function including the time spent in function called from that function. Elapsed time is the time spent between the entry to and exit from a function. “Elapsed Inclusive Time” represents time spent in that function or any of its sub-functions. “Elapsed Exclusive Time” represents the time spent in that function exclusively.
Note that the exclusive time for a function is only a small view of the whole performance picture. A sub-function making a blocking call (to a database or a Web service) will move the thread off the CPU. Looking at the inclusive time for a function may reveal, for instance, parts of the code that blocking and are slowing down the application.
Application time is the amount of elapsed time actually spent executing your code. If a transition between kernel and user mode occurs between two instrumentation points, the time between those instrumentation points is removed from the Application time. So, “Application Inclusive Time” and “Application Exclusive Time” are “Elapsed Inclusive Time” and “Elapsed Exclusive Time” minus the time spent in kernel mode.
Fixing the problem
It turned out, upon further inspection of the PeopleHelper class, that there were two main problems. First, the PeopleHelper.GetPeopleAsStringList() method was using ‘dumb’ string concatenation in a tight loop that caused lots of unnecessary strings to be created. Second, the PeopleHelper class was using an ArrayList to hold value types and every time the value type was put in, or taken out, of the ArrayList then it was getting boxed and unboxed because an ArrayList holds Object references. For more discussions and information about these and other problems see the book Improving .NET Application Performance and Scalability.Here is the offending code that caused the application to run in 8 seconds and allocate 20063 string instances and 30000 Person instances:
public struct Person {
	public string first;
	public string last;
	public int age;
}
public class PeopleHelper {
	static ArrayList _people =
		new ArrayList();
	public static void Add(Person p) {
		people.Add(p); } <– boxing
	public static string
		GetPeopleAsStringList(
		Person[] people) {
		string ret = “”;
		for (int i=0;
			i<people.Length;i++) {
			ret += people[i].first + “ “
				+ people[i].last; <– dumb
		if(i != people.Length-1) <– string
			ret += “,”; <– concatanation
		}
		return ret;
	}
	public static Person[]
		GetPeopleYoungerThan(int age) {
		ArrayList temp =
			new ArrayList();
		foreach (Person p in _people)
			{ <– unboxing
			if (p.age < age)
				temp.Add(p);
		}
	return (Person[])temp.ToArray(
		typeof(Person));
	}
	...
}
Here is the code modified to fix the problems and which caused a significant change in the performance of the application. The application now runs in 0.03 seconds and allocates only 78 string instances and 29 Person instances:
public struct Person {
	public string first;
	public string last;
	public int age;
}
public class PeopleHelper {
		static List<Person> _people =
			new List<Person>();
	public static void Add(Person p) {
		_people.Add(p); } <– no boxing
	public static string
			GetPeopleAsStringList(
				Person[] people) {
		StringBuilder sb =
			new StringBuilder();
		for (int i = 0;
			i < people.Length; i++) {
			sb.Append(people[i].first);
			sb.Append(“ “); <– sensible
			sb.Append(
				people[i].last); <– string
			if (i != people.Length – 1)
			sb.Append(“,”); <– concatanation
		}
		return sb.ToString();
	}
	public static Person[]
		GetPeopleYoungerThan(int age) {
		List<Person> temp =
			new List<Person>();
		foreach(Person p in _people)
			{ <– no unboxing
			if (p.age < age)
				temp.Add(p);
		}
		return
			(Person[])temp.ToArray();
	}
}
Conclusion
A profiling tool gathers data about an executing application in order to measure its performance and find performance hotspots. Visual Studio 2005 Team Edition for Software Developers provides a built-in profiler that is easy to configure and run and provides several report views to study the performance data and help isolate the performance problems. You will get much better success speeding up your code by using this profiler rather than trying to guess where the performance issues are.Simon Horrell is an author and instructor at DevelopMentor, where he develops and delivers .NET courses. Lately he has been pouring all of his energy into Visual Studio Team System. He can be reached at [email protected].
Comments