This article covers Cewolf, a charting and graphing tag library for JSP developers. With Cewolf, you can create web applications incorporating compelling charts and graphs without depending on the availability of client-side Ajax code, Applets, or ActiveX controls. You will create three different charts using Cewolf in this article; the last example will fetch the graph data from a MySQL database.
Introducing Cewolf
Cewolf is a wrapper around the very popular open source JFreeChart library. While JFreeChart’s main focus is on creating graphics in rich-client applications, Cewolf makes it easy to deploy it on the server side.When using Cewolf to create an embedded graph on a JSP page, all you do is:
- Create a JSP page that creates and embeds graphs using Cewolf’s tags
- Write a custom Java class, called a DataProducer that supplies the embedded chart with data to graph
Figure 1 illustrates how the pieces work together, where Cewolf runs as a tag library and a helper servlet in the Tomcat 6 server.
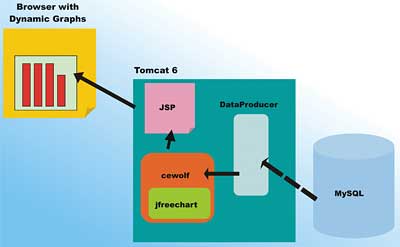
Figure 1: Cewolf in action
When a JSP containing a chart is accessed, the cewolf tag (embedded in the JSP) locates the source of graphing data via the DataProducer class, and then uses the wrapped jfreechart to render the actual chart. The rendered chart is then displayed as part of the JSP rendering process (at a location determined by the <cewolf:img> tag).
You can keep your JSP pages completely free of embedded Java code (a good JSP programming practice for ease of long term maintenance) as the Cewolf component can be created completely using JSTL and EL, without scriplets.
To embed a graph in your JSP, you use a Cewolf tag similar to:
<cewolf:chart id="simplechart"
	type="verticalbar"
	title="VSJ Bar Sample">
	<cewolf:data>
		<cewolf:producer id="simpledata"/>
	</cewolf:data>
</cewolf:chart>
<p/>
<cewolf:img chartid="simplechart"
	renderer="cewolf"
	width="640" height="480"/>
The <cewolf:chart> tag defines the type of chart (verticalbar in this case), and specifies the DataProducer (simpledata in this case). The <cewolf:img> tag actually renders the chart into the page. You will see this action shortly.
Flexible Data Sourcing
Since you are writing the Java DataProducer class from scratch, it can obtain the underlying charting data from any source. For example, the data can come from:
- a relational database
- a flat file
- a shared location where another system occasionally dumps (or pushes) data
- another system that the server polls
- acquired in real-time by the server system
This makes it feasible, for example, to use Cewolf in Tomcat servers used embedded in devices – enabling them to provide sophisticated graphics of the device’s state, data collection progress and performance metrics.
Setup Cewolf and Tomcat
Before we can get started coding, you need to download the latest version of Cewolf.
All the code in this article has been tested with the Cewolf 1.0 stable version.
The source code download includes source code to vsjgraphics.war, which you can deploy to a Tomcat 6 server (assuming that you are using Java SE 6 or later) immediately. The vsjgraphics web application includes all three charts covered in this article.
The Tomcat server used to test the example is Tomcat 6.0.16. If you do not have it, download the latest version of Tomcat 6.
You only need to download the “core” zip file, unzip it in an installation directory (such as c:\tomcat6) and you’re good to go. You can also download the installer version, which allows you to run Tomcat 6 as a Windows Service on your machine.
Preparing the web application
The scriptlets-free JSP code also needs JSTL 1.1 tags. Scriptlets, which are fragments of embedded Java code within JSPs, are despised by most professional Java web application developers since they encourage creation of tricky and difficult to maintain coding. To include JSTL 1.1 in the application, you will need the two supporting tag library files.Download the latest zip, extract it and locate jstl.jar and standard.jar. Place these two files in the classes\lib directory of your web application to deploy JSTL 1.1.
To “install” cewolf into your web application, you need to copy some files to the WEB-INF/lib directory. From the lib directory of the Cewolf distribution, you want to copy some JAR files into your WEB-INF/lib directory. Copy all them except the two named servelet-api-X.X.jar and junit-X.X.jar. Then from the etc directory of the Cewolf distribution, copy the TLDs and overlib.js into your application’s WEB-INF directory. The sample code should already have these libraries in place. You can now use the Cewolf tags in your JSP pages. To include the tags, use the directive at the top of your JSP page:
<%@taglib
	uri='/WEB-INF/cewolf.tld'
	prefix='cewolf' %>
Configuring the Cewolf servlet
Cewolf renders the graphs dynamically using a servlet. You need to configure the Cewolf servlet in your web application descriptor (WEB-INF/web.xml file). Add the following highlighted lines in your web.xml:<?xml version="1.0" encoding="UTF-8"?>
<web-app xmlns:xsi="http://www.w3.org/
2001/XMLSchema-instance"
xmlns=http://java.sun.com/xml/ns/javaee
xmlns:web="http://java.sun.com/xml/ns/
javaee/web-app_2_5.xsd"
xsi:schemaLocation="http://java.sun.com/
xml/ns/javaee
http://java.sun.com/xml/
ns/javaee/web-app_2_5.xsd"
id="WebApp_ID" version="2.5">
<display-name>vsjgraphics
</display-name>
<servlet>
<servlet-name>CewolfServlet
</servlet-name>
<servlet-class>
de.laures.cewolf.CewolfRenderer
</servlet-class>
<init-param>
<param-name>storage</param-name>
<param-value>
de.laures.cewolf.storage.
TransientSessionStorage
</param-value>
</init-param>
<init-param>
<param-name>overliburl</param-name>
<param-value>WEB-INF/overlib.js
</param-value>
</init-param>
<load-on-startup>1
</load-on-startup>
</servlet>
<servlet-mapping>
<servlet-name>CewolfServlet
</servlet-name>
<url-pattern>/cewolf/*
</url-pattern>
</servlet-mapping>
<session-config>
<session-timeout>1
</session-timeout>
</session-config>
...
</web-app>
A very simple bar chart
To create a quick chart, let’s take a look at the simplest data provider possible. It simply provides a series of data points between 1 to 10 that plots the value i against i * i – an exponential curve. The code for this provider is shown in the following listing. The Cewolf provider must implement the DataProducer interface. This requires the implementation of the three methods shown below.public class SimpleDataProvider
implements DatasetProducer,
Serializable {
public String getProducerId() {
return "uk.co.vsj.graph.simpledata";
}
public boolean hasExpired(
Map arg0, Date arg1) {
// assuming data does not change
// - never expires
return false;
}
public Object produceDataset(Map arg0)
throws DatasetProduceException {
DefaultCategoryDataset dataset =
new DefaultCategoryDataset();
for (int i =1; i <= 10; i++) {
dataset.addValue(i*i,
"first series", new Integer(i));
}
return dataset;
}
}
The DefaultCategoryDataset helper class makes creating dataset straightforward – just create an instance and then add values to it via the addValue() method. The addValue() method takes three arguments, the first is the value, the second is the name for the series of data (you can plot multiple series side-by-side as you will see later), and the third is the category – and should be a value that can be sorted (such as an Integer) in our case.
The DataProducer that you create must be wired to a Cewolf chart object that is configured within a JSP. The JSP page that embeds this simple graph is called graph1.jsp and is shown in the following listing:
<%@ page language="java"
	contentType="text/html;
	charset=ISO-8859-1"
	pageEncoding="ISO-8859-1"%>
<%@taglib uri='/WEB-INF/
	cewolf.tld' prefix='cewolf' %>
<!DOCTYPE html PUBLIC "-//W3C//
	DTD HTML 4.01 Transitional//EN"
"http://www.w3.org/TR/html4/loose.dtd">
<html>
	<head>
		<meta http-equiv="Content-Type"
content="text/html; charset=ISO-8859-1">
		<title>VSJ Bar Sample</title>
	</head>
	<body>
		<jsp:useBean id="simpledata"
			class="uk.co.vsj.graph.
			SimpleDataProvider"/>
		<cewolf:chart id="simplechart"
			type="verticalbar"
			title="VSJ Bar Sample">
			<cewolf:data>
			<cewolf:producer id="simpledata"/>
			</cewolf:data>
		</cewolf:chart>
		<p/>
		<cewolf:img chartid="simplechart"
			renderer="cewolf"
			width="640" height="480"/>
		<p/>
	</body>
</html>
In the preceding code, the <jsp:useBean> tag is used to create an instance of the SimpleDataProvider class that the cewolf chart uses to produce data. The <cewolf:chart> tag, named simplechart, is created with type=”verticalbar”. The subelement <cewolf:data> is used to specify the data producer to be used for the chart.
To actually render and display the graph image, the <cewolf:img> tag is used to place the resulting graph image onto the JSP.
As well as type=”verticalbar”, you can define a large variety of chart types supported by the underlying jfreechart library, including: area, areaxy, candlestick, gantt, highlow, horizontalbar, horizontalbar3d, line, pie, pie3d, scatter, signal, stackedhorizontalbar, stackedverticalbar, stackedverticalbar3d, timeseries, verticalbar3d, verticalxybar, wind, and xy.
The variety of available charts, plus the possibility of combining multiple presentations, creates very rich set of expressive graphics that can be displayed using this solution.
To see the resulting graph1 (see Figure 2), deploy the vsjgraphics.war file to Tomcat and point your browser to:
http://localhost:8080/vsjgraphics/
	graph1.jsp
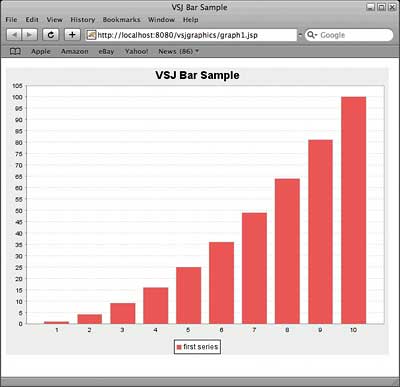
Figure 2: graph1.jsp, displaying the data generated by the SimpleDataProvider
Displaying a Multi-series 3D Chart
It is actually quite straightforward to present moderately complex data. Next, you will create a different DataProducer and a new JSP page to display a multiple series of data with a 3D bar chart presentation. The new DataProducer is named SeriesDataProvider. Again the crux of the work is in the produceDataset() method. The following listing shows the code to SeriesDataProvider.java:public class SeriesDataProvider
implements DatasetProducer,
Serializable {
public String getProducerId() {
return "uk.co.vsj.graph.seriesdata";
}
public boolean hasExpired(
Map arg0, Date arg1) {
// assuming data does not change
// - never expires
return false;
}
public Object produceDataset(Map arg0)
throws DatasetProduceException {
DefaultCategoryDataset dataset =
new DefaultCategoryDataset();
for (int i =1; i <= 10; i++) {
dataset.addValue(i*i,
"first series", new Integer(i));
dataset.addValue(i,
"second series",
new Integer(i));
dataset.addValue(
(11 -i) * (11-i),
"third series", new Integer(i));
}
return dataset;
}
}
The highlighted code shows the three series that are added to the DefaultCategoryDataset. The first series, named “first series”, is the same as the one in graph1.jsp and shows i*i against i. The “second series” simply shows the value of i. The “third series”, is a kind of inverted version of the first series – showing i*i from 10 down to 1.
The cewolf chart that you will create in this case will show each of the three series side-by-side. This presentation can be useful when you are visually comparing the value of multiple series of numbers. The JSP code, graph2.jsp, is shown in the following listing:
<%@ page language="java"
	contentType="text/html;
	charset=ISO-8859-1"
	pageEncoding="ISO-8859-1"%>
<%@taglib uri='/WEB-INF/cewolf.tld'
	prefix='cewolf' %>
<!DOCTYPE html PUBLIC "-//W3C//
	DTD HTML 4.01 Transitional//EN"
"http://www.w3.org/TR/html4/loose.dtd">
<html>
	<head>
		<meta http-equiv="Content-Type"
			content="text/html;
			charset=ISO-8859-1">
	<title>VSJ Multi-series Bar Sample
		</title>
	</head>
	<body>
	<jsp:useBean id="seriesdata"
		class="uk.co.vsj.graph.
		SeriesDataProvider"/>
	<cewolf:chart
		id="serieschart"
		type="verticalbar3d"
	title="VSJ Multi-series Bar Sample">
		<cewolf:data>
			<cewolf:producer id="seriesdata"/>
		</cewolf:data>
	</cewolf:chart>
	<p/>
	<cewolf:img chartid="serieschart"
		renderer="cewolf"
		width="640" height="480"/>
	<p/>
	</body>
</html>
Other than the change of the DataProducer class, the only change is the type attribute of the <cewolf:chart> element to verticalbar3d, from verticalbar. The resulting graph (see Figure 3) can be viewed via the URL:
http://localhost:8080/vsjgraphics/
	graph2.jsp
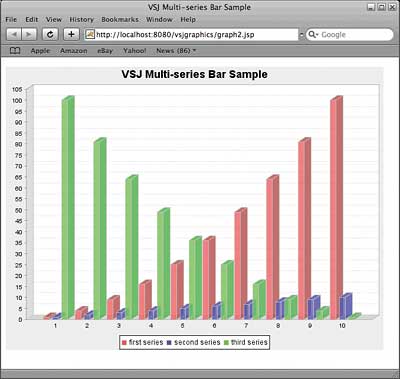
Figure 3: graph2.jsp, displaying the multi-series 3-D bar chart
Data sourced from MySQL
It’s time to get more serious about the source of the data being plotted. Instead of generating numbers to be displayed, the next graph fetches the data to be plotted in real-time from a back-end relational database. You will need to have MySQL installed and working to try this. The code has been tested against the latest version of MySQL Server 5.1. To enable access to MySQL from Tomcat you need to download and install the latest JDBC driver.In this example, Connector/J 5.1 is used. After downloading and unarchiving the driver, you want to copy the mysql-connector-java-X.X.X-bin.jar file into the lib directory of your Tomcat 6 installation. This enables both the Tomcat server and your application to use the driver to access MySQL databases.
To setup the MySQL database for this example, you first need to:
- create a database named vsjdb
- create a user named vsjdb with password vsjdb that can create tables in the database
mysql -uvsjdb -pvsjdb
	-hlocalhost vsjdb < createtable.sql
Again, this assumes that you have the database and vsjdb user setup, and that the MySQL server is running on the same machine as your Tomcat server. The createtable.sql script will create a sales table, and populates it with data as shown in Table 1.
| Table 1: The sales table created by createtable.sql script | |
| Location | Copies |
| East | 20 |
| West | 10 |
| East | 2 |
| South East | 13 |
| North | 3 |
| West | 22 |
| North | 24 |
| West | 19 |
| South West | 28 |
The pie chart displays total sales by region. In order to get this summary, the DBDataProvider.java class that you create will perform a summarizing SQL query against the database:
select location,
	sum(copies) as sold
	from sales
	group by location
	order by location;
JNDI based resource lookup in Tomcat 6
To enable access to JDBC from JSPs running in Tomcat 6 access, you need to create an instance of the MySQL JDBC driver as a resource that can be looked up using JNDI.First, create a context.xml file, and place it under the META-INF directory of the vsjgraphics web application. The context.xml file contains the information required to instantiate the JDBC driver:
<Context>
	<Resource
		name="jdbc/vsjdb"
		auth="Container"
		type="javax.sql.DataSource"
		username="vsjdb"
		password="vsjdb"
driverClassName="com.mysql.jdbc.Driver"
		url="jdbc:mysql://localhost/vsjdb"
		maxActive="8"
		maxIdle="4"
	/>
</Context>
Then, a resource reference needs to be added to the web application descriptor (web.xml). The following listing shows the lines that must be added to web.xml:
<?xml version="1.0" encoding="UTF-8"?>
<web-app xmlns:xsi="http://www.w3.org/
	2001/XMLSchema-instance"
xmlns=http://java.sun.com/xml/ns/javaee
	xmlns:web="http://java.sun.com/
	xml/ns/javaee/web-app_2_5.xsd"
xsi:schemaLocation="http://java.sun.com/
	xml/ns/javaee
	http://java.sun.com/xml/ns/
	javaee/web-app_2_5.xsd"
	id="WebApp_ID" version="2.5">
<display-name>vsjgraphics</display-name>
	<servlet>
		<servlet-name>CewolfServlet
			</servlet-name>
		<servlet-class>
			de.laures.cewolf.CewolfRenderer
		</servlet-class>
...
	<welcome-file-list>
...
	</welcome-file-list>
	<resource-ref>
		<description>JDBC connection
			</description>
	<res-ref-name>jdbc/vsjdb
		</res-ref-name>
	<res-auth>Container</res-auth>
	</resource-ref>
</web-app>
Creating a DBDataProvider
The JDBC DataSource used by the DBDataProvider class is injected by the JSP (graphdb.jsp) when it starts up. This is provisioned by defining a setDatasource() method in the DBDataProvider class, as shown in the following code excerpt from DBDataProvider.public class DBDataProvider
implements DatasetProducer,
Serializable {
private DataSource dbsrc = null;
public void setDatasource(
DataSource indb) {
dbsrc = indb;
}
...
}
Once the dbsrc variable is injected with the DataSource from the JSP, Cewolf can call other methods such as produceDataset() to obtain the data from the relational database.
In the following listing, you can see JDBC prepared statement being used to query the database for the summary data. The SQL query used has been presented earlier. A JDBC prepared statement is used to house the query. In production, you can readily parameterize and reuse such a prepared statement. The query is executed, and the returned JDBC ResultSet is parsed for the summarized values required to produce the dataset.
public Object produceDataset(Map arg0)
	throws DatasetProduceException {
	DefaultPieDataset dataset =
		new DefaultPieDataset();
	Connection conn = null;
	PreparedStatement salesquery = null;
	ResultSet res = null;
	try {
		conn = dbsrc.getConnection();
		salesquery = conn.prepareStatement(
		"select location, sum(copies) as
		sold from sales group by location
		order by location");
		res = salesquery.executeQuery();
		while(res.next()) {
			// JDBC columns starts at 1
			String location =
				res.getString(1);
			double sold = res.getDouble(2);
			dataset.setValue(location, sold);
		}
		} catch (SQLException e) {
			e.printStackTrace();
		} finally {
		...
		}
	return dataset;
	}
Note in the above code that a DefaultPieDataset is created instead of the familiar DefaultCategoryDataset. This is because this time you’re drawing a pie chart. The PieDataset.setValue( label, value) method is used to set the slices of the chart, as they are retrieved from the ResultSet from the database query.
Switching to a Cewolf pie chart
Instead of using another bar chart, the JSP has been modified to display a pie chart. The code is in graphdb.jsp, and the minimal code modifications are highlighted in the following listing.<%@ page language="java" contentType="text/html; charset=ISO-8859-1" pageEncoding="ISO-8859-1"%> <%@taglib uri='/WEB-INF/cewolf.tld' prefix='cewolf' %> <%@ taglib prefix="c" uri="http://java. sun.com/jsp/jstl/core" %> <%@ taglib prefix="sql" uri="http://java.sun.com/jsp/jstl/sql" %> <!DOCTYPE html PUBLIC "-//W3C// DTD HTML 4.01 Transitional//EN" "http://www.w3.org/TR/html4/loose.dtd"> <html> <head> <meta http-equiv="Content-Type" content="text/html; charset=ISO-8859-1"> <title> VSJ Database Sourced Data Sample </title> <sql:setDataSource dataSource="jdbc/vsjdb" var="vsjdb" /> </head> <body> <jsp:useBean id="dbdata" class="uk.co.vsj.graph.DBDataProvider" /> <jsp:setProperty name="dbdata" property="datasource" value="${vsjdb}" /> <cewolf:chart id="dbchart" type="pie" title="VSJ Database Sourced Data Sample"> <cewolf:data> <cewolf:producer id="dbdata"/> </cewolf:data> </cewolf:chart> <p/> <cewolf:img chartid="dbchart" renderer="cewolf" width="640" height="480"/> <p/> </body> </html>In the preceding JSP, <jsp:useBean> is used to instantiate the DBDataProvider. The JSTL <sql:setDataSource> tag is used to lookup a JDBC databasource via the JNDI name “jdbc/vsjdb”, and assign the datasource to the vsjdb variable.
This datasource is then injected into the DBDataProvider using the <jsp:setProperty> tag. This ensures that DBDataProvider can access the MySQL database to fetch its summary dataset.
You can see the pie chart of sales by pointing your browser to:
http://localhost:8080/vsjgraphics/graphdb.jspFigure 4 shows the resulting pie chart, plotted with live data fetched from the MySQL relational database.
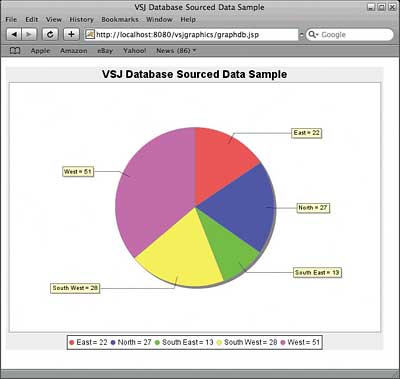
Figure 4: Pie chart based on MySQL data
Conclusions
The Cewolf JSP tag library offers the server-side Java developer a highly versatile suite of charting and graphical visualization building blocks. The tag library can be used without the need for embedded Java coding in JSP pages. Data used in creating the graphs is sourced from Java classes that implement the well-specified DataProducer interface. These classes can in turn obtain the data from relational databases or specific data sources. Complex charts and business graphics are no longer the exclusive domain of client-side application developers.
Sing Li has been writing software, and writing about software for twenty plus years. His specialties include scalable distributed computing systems and peer-to-peer technologies. He now spends a lot of time working with open source Java technologies. Sing’s most recent publications include Professional Geronimo and Professional Apache Tomcat from Wrox Press.
Comments