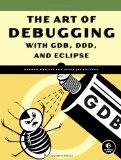
Debugging is of central importance to successful software development, and yet many beginning programmers are unaware of the techniques they can use to reduce the time they spend finding and fixing programming errors. GDB, a popular open source debugger, allows a programmer to trace program execution line by line, set breakpoints, inspect variables, and look at what the program is doing at any given time. Using an assortment of real world coding errors "from simple typos to major logical blunders "The Art of Debugging with GDB and DDD discusses how to manage memory, understand core dumps, and trace programming errors to their root cause. The book covers topics other debugging books omit "such as threaded, server/client, GUI, and parallel programming "as well as how to avoid common debugging pitfalls. Readers also learn about techniques and tools they can use to prevent errors, saving themselves valuable time and effort.
The Art of Debugging with GDB, DDD, and Eclipse

- Authors
- Norman Matloff, Peter Jay Salzman
- ISBN
- 1593271743
- Published
- 29 Sep 2008
- Purchase online
- amazon.com
Debugging is of central importance to successful software development, and yet many beginning programmers are unaware of the techniques they can use to reduce the time they spend finding and fixing programming errors. GDB, a popular open source debugger, allows a programmer to trace program execution line by line, set breakpoints, inspect variables, and look at what the program is doing at any given time.
- Editorial Reviews
- Customer Reviews
Editorial Reviews
You might also like...
.NET books
-
Ubuntu Unleashed 2012 Edition: Covering 11.10 and 12.04 (7th Edition) (7th Edition)
Ubuntu Unleashed is filled with unique and advanced information for everyone who wants to make the most of the Ubuntu Linux operating system. This new edition has been thoroughly revised and updated by a long-time Ubuntu community leader to reflect t...
.NET jobs
-
PHP/HTML Developer
Pure Innovation Ltd in Odiham, United Kingdom
£32,000-36,000 GBP per year
.NET podcasts
-
Ubuntu UK Podcast: S05E20 – The Cult of Incompetence
Published 8 years ago, running time 1h0m
Alan Pope, Mark Johnson, Tony Whitmore, Laura Cowen, and podcats are back in Studio A for the twentieth episode of Season Five of the Ubuntu Podcast from the UK LoCo Team! In this week’s show:- We interview Kevin Safford about his plans to use Linux to support Alzheimer’s sufferers. We discuss th.
Comments