Ed’s Note: This is an extract from the book JavaScript & Query: The Missing Manual by David Sawyer McFarland. For Source Code, Sample Chapters and other resources, go to http://www.oreilly.com
In this tutorial, you’ll use Firebug to debug a file that’s filled with various types of errors (syntax errors, runtime errors, and logic errors). The page is a simple quiz program that poses three questions and prints quiz results. (Open the complete_debugger.html file [from the download at the top of the page] to see how the page is supposed to work.)
To complete this tutorial, you’ll need run the Firefox web browser and have the Firebug extension installed and turned on-see Debugging with Firebug for instructions.
- Start Firefox and open the file debugger.html from the download. In the top, right of the browser window, Firebug indicates that there is 1 error (see Figure 15-8). You must open the Firebug console to find out what’s wrong.
Click the Firebug icon in the top right of the browser to open Firebug, and select the Console tab. You should see the error message in Figure 15-8: Missing ] after element list. Square brackets are used for creating arrays (see Creating an Array), so it appears that one of an array’s closing brackets is missing. This omission is a syntax error (see the box on Types of Errors) because it represents a grammatical error in the code (like a sentence missing a period). You’ll notice that to the right of the error message, Firebug lets you know that this error occurred in line 15.
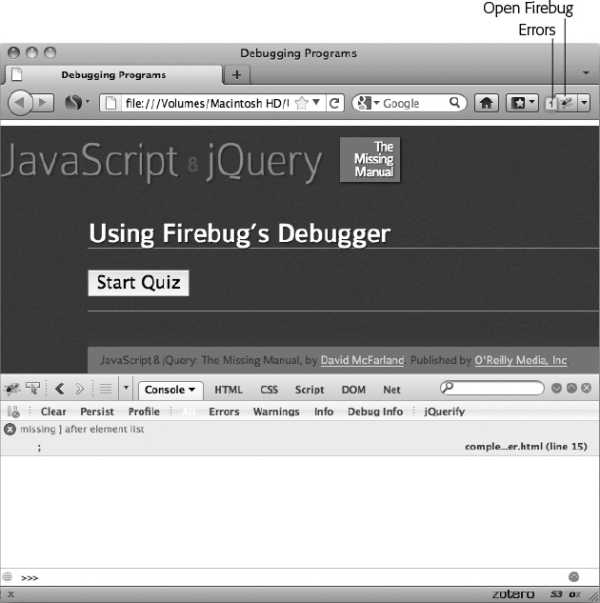
Figure 15-8. The Firebug console is the first stop for tracking down syntax and runtime errors that bring a script to its knees.
Launch your text editor and open the file debugger.html. Locate line 15 (it’s a single ; on a line by itself). Type a closing square bracket before the ; so the line looks like this:
];
This bracket ended a nested array (Tutorial: A Simple Quiz) that contained all of the questions and answers for the quiz.
Save the file; return to Firefox, and reload the page.
Another error! This time the error console says $ is not defined and points to line 10 containing jQuery’s $(document).ready() function. When Firefox reports that something’s not defined, it means the code is referring to something that doesn’t exist, which could be the name of a variable or a function that hasn’t yet been created. Or you might just have a typo in the code. In this case, the code looks OK. The culprit is actually earlier on the page, in this code:
<script src="_js/jquery-1.6.3.min.js"></script>
A common problem when working with external scripts is accidentally typing the wrong path to the script. In this case, the jquery-1.6.3.min.js file is located inside a folder named _js that’s outside this file’s folder. The code here says that the file should be inside the same folder as this web page; because Firefox can’t find the jquery-1.6.3.min.js file (where jQuery’s special $() function is defined), it spits out an error.
Change the <script> tag to read:
<script src="../_js/jquery-1.6.3.min.js"></script>
The ../ indicates that the js folder is outside this folder, and the path is now correctly pointing to the jQuery file. What else could be wrong with this program?
-
Save the file; return to Firefox and reload the page. No errors! Looks like the page is fixed! Or is it?
-
Click the Start Quiz button on the web page.
Bam! Another error. This time the console reports that askQuestions is not defined and points to line 69 near the end of the script. Since this error only appears while the program is running, it’s called a runtime error (see the box on Types of Errors). The problem appears toward the end of the script, within this conditional statement:
if (quiz.length>0) {
  askQuestions();
} else {
  giveResults();
}
By now it’s probably dawning on you that when something’s not defined, it’s often just because of a simple typo. In this case, askQuestions() is a call to a function, so take a moment now to look through the code and try to find this function.
Did you find it? While there isn’t an askQuestions() function, you should have noticed an askQuestion() function (without an s).
-
Return to your text editor, and then remove the last s from askQuestions() in line 70 (near the end of the script). Save the file, reload it in Firefox, and then click the Start Quiz button again.
Now, a quiz question appears along with five multiple-choice options. Unfortunately, the last option has a label of undefined. Smells like an error. However, the Firebug console is empty, so technically there’s no JavaScript error. Something must be wrong with the program’s logic. To get to the bottom of the trouble, you’ll need to use Firebug’s debugger.
-
In Firebug, click the Script tab and select debugger.html from the source menu directly above the Script tab (see Figure 15-9).
The Script tab gives you access to the page’s JavaScript. If the page includes JavaScript and you’ve linked to other external JavaScript files, the Source menu lets you choose which JavaScript code you wish to debug.
Because the undefined radio button seems to be out of place, the code that creates the radio buttons is a good place to start looking for this bug. If you had written this script, you’d probably know just where to look in your code; however, if you were just handed this buggy script, you’d have to hunt around until you found that part of the script.
In this case, the radio buttons are created within a function named buildAnswers(), whose purpose is to build a series of multiple choice options represented by radio buttons. That function is passed an array that includes a list of values for each radio button. When the function is done, it returns a string containing the HTML for the radio buttons. So this function’s a good place to start debugging.
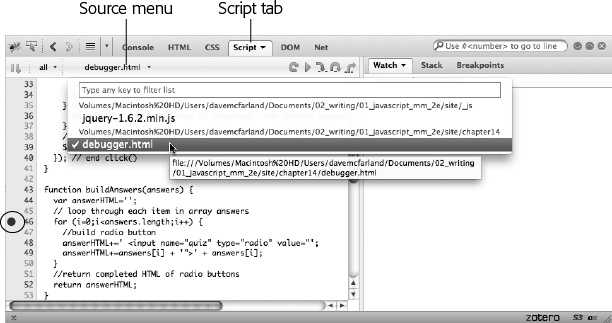
Figure 15-9. In Firebug, you can debug any scripts that the current page uses. The Source menu lets you select the JavaScript embedded in the current web page or from any attached external JavaScript file.
-
In Firebug’s Script tab, scroll down until you see line 47. Click to the left of 46 to insert a breakpoint (circled in Figure 15-9).
A red dot appears to the left of line 46. The dot indicates a breakpoint, or a spot in the code, where the JavaScript interpreter stops running the script. In other words, when this script runs again, the moment the JavaScript interpreter hits that line, it stops, and you’ll be able to step line by line through the code to see what’s happening under the hood.
The debugger also lets you look at the values of variables as the program runs, much as you used the console.log() function on Using console.log() to Track Script Progress. You’ll tell Firebug what variables you want to track next.
-
In the right side of the Firebug window, click the New Watch Expression bar, type i, and then press the Return (or Enter) key.
This step adds the variable i to the Watch list. That variable is used in the for loop as a counter to track how many times the loop runs (see For Loops for more on for loops). As the script runs, you’ll be able to see how that value changes. Next, you’ll add another variable to watch.
-
Click the New Watch Expression bar again, type answers.length, and then hit Return.
Don’t worry about the value Firebug displays at this point (it probably says answers is not defined). You can’t track the values of many variables until you’re actually running the debugger and are inside the function where the variable lives. Now it’s time to take a look inside the script.
-
Click Firefox’s Reload button or press Ctrl+R. When the page reloads, click the Start Quiz button on the web page.
The script starts, and the first question is written to the web page. But when it comes time to create the radio buttons, the debugger stops at line 46 (see the top image in Figure 14-10). Notice that in the Watch tab, the value for i is not defined. That’s because the breakpoint stops the program just before the line is executed. In other words, the loop hasn’t started, and the i variable hasn’t yet been created.
However, the value of answers.length is set to 4. The array answers is an array of answers that was passed to the function (you can see the array elements listed lower down in the Watch list). An array’s length property indicates the number of items in the array; in this case there are four, so you should get four radio buttons when the function’s completed.
-
Click the Step Over button (see Figure 15-10).
This button takes you to the next line in the program. Now you can see that i is set to 0. You’ll keep clicking through this loop.
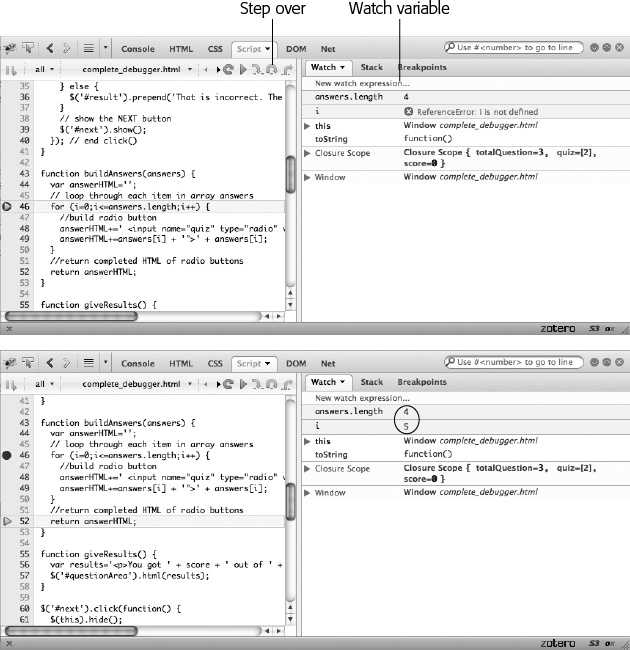
Figure 15-10. When you step through a program using Firebug, red circles to the right of a line number indicate a break point, while yellow arrows indicate the line of code that the JavaScript interpreter is currently stopped at. Click Step Over (or Step Into) to run that line of code and stop at the next line.
-
Click the Step Over button until you see the value of i change to 5 in the Watch list (bottom image in Figure 15-10).
Although there are only four items in the answers array, you can see that the for loop is actually running five times (the value of i). So something’s funny about how the loop is terminated. Remember that in a for loop, the middle statement in the for statement is the condition that must be true for the loop to run (see For Loops). In this case, the condition is i<=answers.length;. In other words, the loop starts out with i containing 0 and continues to run as long as i is less than or equal to the number of items in the answers array. In other words, i will be 0, 1, 2, 3, and 4 before it terminates-that’s five times. However, since there’s only four items in the answers array, the fifth time through the loop there are no more answers to print: undefined is printed because there is no fifth item in the answers array.
-
Return to your text editor, and change the for loop at line 46 to read:
for (i=0;i<answers.length;i++) {Now the loop only runs for the number of items in the answers array, creating one radio button for each possible answer.
-
Save the file, and preview it in Firefox.
You can turn off the breakpoint by clicking its red dot in the firebug script window to see the finished page run without interruption.
The page complete_debugger.html contains the completed version of this tutorial. As you can see, finding bugs in a program can take a lot of work. But a debugging tool like Firebug makes it a lot easier to see inside a program’s guts and find out what’s going wrong.

Comments