This article shows how to effectively use code analysis, and explains how it is an integral part of the build process, how it integrates with aspects of Visual Studio Team System, and how custom rules can be written and deployed to enforce the coding discipline in place for your organisation.
Even if your code is syntactically correct and passes all the compiler checks it may still have issues that need to be resolved. If you did not employ best practices then your code may, for example, not perform well, not be scalable, or not be secure. This means that your code is an accident waiting to happen later on in the project lifecycle. For this reason, code needs to be reviewed regularly.
The later in the development cycle you leave it to review code, and the less often you do it, the more it is going to cost – in terms of both time and resources – to fix the resultant problems. Code needs to be reviewed early in the development lifecycle so that defects can be identified before the code ever executes. Code needs to be reviewed often, in an ideal world as part of every build. Code review is also a useful way to educate developers as to the mistakes they are making and to teach them what the best practices are so that they can benefit from the bitter experience of others in the past.
One approach is to have formal code reviews performed as part of your development lifecycle by teams of senior architects and developers. However, this is time-consuming and labour-intensive. It can also be inconsistent, dependent on the exact nature of the review team, plus you can’t perform a formal code review on every build!
The Visual Studio 2005 code analysis tool
The alternative is to somehow distil the experience of the code review team and automate the process of checking code. There are code analysis tools available that can readily identify defect patterns that match specified rules. These rules can, amongst other things, check coding and design guidelines, check for security issues or identify potential performance problems. They can also supply information about the exact nature of the problem and suggest remedies. One such code analysis tool is integrated into the Visual Studio 2005 IDE. It analyses managed code and is based on a tool called FxCop, an old favourite with the developer community.Microsoft promotes a set of best coding practices for .NET through the .NET Framework Design Guidelines for Class Library Developers. These guidelines stem from lessons learnt while developing and applying the .NET Framework. The CLR team devised a tool called FxCop to enforce these rules and to help transfer expert knowledge regarding technical issues and programming ‘gotchas’ from the CLR team to other developers. Their aim was to help establish best practices that minimise code defects and maintenance costs. Essentially, FxCop extends the set of compiler-provided checks by applying an additional set of built-in rules that check assemblies for conformance to Microsoft’s .NET framework design guidelines. As we shall see later, it is also possible to create and deploy your own custom rules. The free, stand-alone version of FxCop is still fully maintained and available, even though it is now part of Visual Studio 2005 Professional edition and above. By the way, there is also a code analysis tool for unmanaged code built into Visual Studio 2005, based on a tool called PREfast, which spots defects in C/C++ source.
To run code analysis on demand from within Visual Studio 2005 simply select the “Build” menu’s “Run code analysis on project name” option as shown in Figure_1.
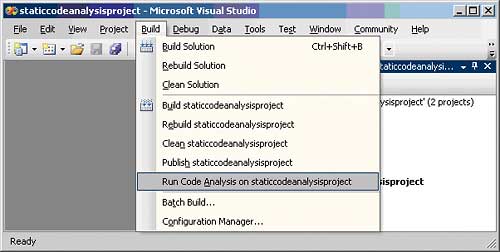
Figure 1: On demand code analysis
Alternatively, to run code analysis as part of the build process from with Visual Studio 2005, select the project properties and on the “Code Analysis” tab check the “Enable Code Analysis” checkbox as shown in Figure_2.
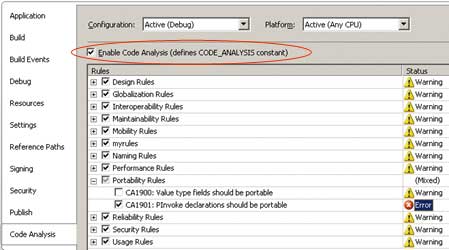
Figure 2: Code analysis as part of the build
Notice that you can be selective about which rules (or groups of rules) are executed and whether a rule violation manifests as an error or a warning. The result of running code analysis is shown in Figure_3.
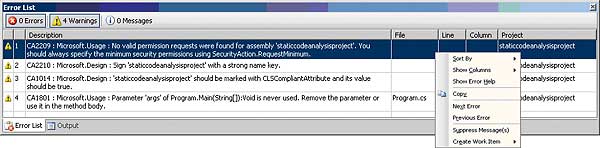
Figure 3: A completed code analysis
The “Error List” window provides information about each rule violation – exactly what went wrong, where it went wrong and what you can do to fix it.
Suppression of rule violation messages
In the interest of reducing the number of errors that you are immediately interested in fixing, you can suppress certain rule violation messages and come back to them later (see the “Suppress Message(s)” menu item on the context menu in Figure_3). Each assembly-level message suppression is defined by using the System.Diagnostics.CodeAnalysis.SuppressMessageAttribute attribute. These are placed in a file called GlobalSuppressions.cs for a C# project. Below is an example of how to suppress messages for violations of rule CA2209 on an assembly-wide basis.[assembly: System.Diagnostics.CodeAnalysis. SuppressMessage(“Microsoft.Usage”, “CA2209:AssembliesShouldDeclareMinimum Security”)]It is also possible to use this attribute to suppress rule violation messages for a particular code artefact it applies to:
class foo {
	bool _x;
	[System.Diagnostics.CodeAnalysis.
		SuppressMessage(
		“myrules.general”, “MR0002”)]
	public bool X { set { _x=value; } }
	public bool GetX() { return _x; }
}
Code analysis output
The presence of an empty file called projectname.[exe][dll].lastcodeanalysissucceeded in the project output directory indicates the success or failure of code analysis. If code analysis succeeds (perhaps with warnings), the file timestamp is updated. If code analysis fails (because some rule violations were marked as errors) then the build fails and this file gets deleted.Running code analysis also produces an XML log file in the project output directory called projectname.[exe][dll].CodeAnalysisLog.xml. Visual Studio contains a set of XSL transforms for providing different report views of the information in this file. One of these is set as the stylesheet for the log file and an example of its output is shown in Figure_4.
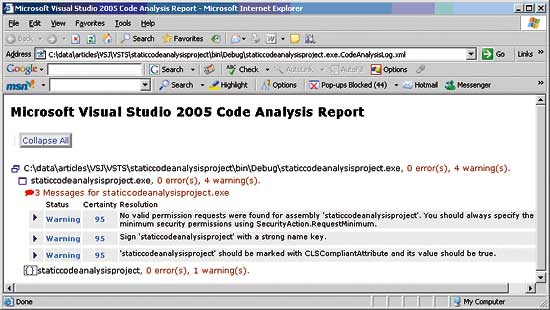
Figure 4: The log file
Integrating code analysis into the development lifecycle
Microsoft has worked hard to integrate code analysis into the development lifecycle. Support for code analysis is not just wired into Visual Studio 2005 but is also integrated into the default build process defined by MSBuild, Microsoft’s new build environment shipped with the .NET Framework. You can run code analysis on a project from within Visual Studio 2005 because it uses MSBuild’s default build process. However you can also run code analysis when building the same project from the command-line as part of an automated build.Given the settings in Figure_2, you would see the following appear in the underlying (MSBuild) project file:
<Project DefaultTargets=”Build”
xmlns=”http://schemas.microsoft.com/developer/msbuild/2003”>
	...
	<PropertyGroup Condition=”’$(Configuration)|$(Platform)’
			==’Debug|AnyCPU’”>
		...
		<RunCodeAnalysis>true</RunCodeAnalysis>
		<CodeAnalysisRules>
			+!Microsoft.Portability#CA1901;
			-Microsoft.Portability#CA1900
		</CodeAnalysisRules>
	</PropertyGroup>
...
	<Import
	Project=”$(MSBuildBinPath)\Microsoft.CSharp.targets” />
	...
</Project>
The RunCodeAnalysis and CodeAnalysisRules properties (shown in bold above) are used by the part of the build process that performs code analysis. The file Microsoft.CSharp.targets includes common constructs that define the build process for a C# project. Indirectly, it imports the file Microsoft.CodeAnalysis.targets which contains a RunCodeAnalysis task that is sensitive to the RunCodeAnalysis and CodeAnalysisRules properties.
Support for code analysis is also integrated into Visual Studio Team System. For instance, it is possible to specify a code check-in policy that mandates that no code can be checked into the VSTS version control repository until code analysis has been successfully run. Also, a VSTS work item can be associated with a code analysis rule violation, ensuring that the underlying problems get tracked and fixed. Code analysis can also be specified as part of an automated VSTS Team Build.
How FxCop works
FxCop is a binary analyser, not a source code analyser, which means that it reads assembly metadata and IL to find out what code does. The upside of this is that you can analyse any version of an assembly written in any .NET language. The downside is that you can’t check for issues that exist only in source code, for example programming constructs that have no corresponding IL constructs (e.g. for loops and while loops) or style issues (e.g. placement of white space, curly brackets etc). The engine that cracks binaries and extracts IL and metadata for analysis uses ‘introspection’ and not .NET reflection. Introspection adopts a more passive approach that doesn’t load the assembly into the .NET runtime, so it is faster and doesn’t lock the assembly so, for instance, assemblies can be rebuilt while FxCop is analysing them.Writing a custom rule
Details of the introspection engine become apparent when you write your own custom rule. FxCop is bundled with many useful rules but you may want to write your own in order to capture some additional code analysis rules that your organisation likes to enforce. For instance, in this case we are going to write a custom rule that checks for the existence of write-only properties and suggests that they be replaced by an explicit setter method.The steps to build a rule are quite straightforward and are exactly the same steps that Microsoft used to build the rules that bundle with FxCop.
- Author a .NET class to represent the rule. This class will derive from an FxCop base class called Microsoft.FxCop.Sdk.Introspection.BaseIntrospectionRule.
- Author an XML description of the rule. This will contain information such as the rule violation description and information about how to fix the violation.
- Deploy the rule so that FxCop can find it.
Next, you’ll need to create a new class. The file containing the class must ‘import’ the correct namespaces as shown below:
using Microsoft.FxCop.Sdk;
using Microsoft.FxCop.Sdk.Introspection;
using Microsoft.Cci;
The class that a custom rule derives from, BaseIntrospectionRule, has a constructor that takes three parameters – the type name of the rule, the fully qualified name of the embedded resource file that contains the XML description of the rule and the name of the assembly that contains this embedded resource file. If you are going to be writing several rules in the same assembly, which is likely, then defining a common base class makes sense so that the details of the embedded resource file and its containing assembly can be defined just once. An example of such a base class is:
public abstract class MyCustomRuleBase :
	BaseIntrospectionRule
{
	protected MyCustomRuleBase(
		String name):
		base(name, “myrules.RuleData”,
	typeof(MyCustomRuleBase).Assembly)
	{
	}
}
Now you can define the rule class and derive it from the common base:
public class WriteOnlyPropertyRule :
	MyCustomRuleBase
{
	public WriteOnlyPropertyRule() :
		base(“WriteOnlyPropertyRule”)
	{
	}
	...
}
As FxCop parses the assembly under analysis, its introspection engine runs all the active deployed rules. It does this by calling into several ‘well-known’ virtual methods defined by each rule’s BaseIntrospectionRule base class. The rule must implement its functionality by overriding one or more of these virtual functions. The first challenge is to figure out which virtual function(s) to override. The second challenge is to understand the introspection API and write code to enforce the rule. Luckily there are some good references on the Web and some great tools, such as Lutz Roeder’s excellent Reflector for .NET tool, which can be used to figure out what FxCop’s built-in rules are doing. Armed with this information, it soon becomes apparent that there are a number of overloaded Check() methods that are called during the execution of the rule. The one you need to override in this case has the following signature:
public virtual ProblemCollection
	Check(Member member)
This method gets called to check every class member – the Member type represents some kind of class member, e.g. field, property, method – and you want to check all property definitions. Inside the method body it is then just a case of typecasting the Member to a Property (if it is indeed a property), obtaining the property information and seeing if we are dealing with a write-only property. If so, the base class’s Problems collection is populated with a new Problem to define the details of the rule violation and how it can be fixed:
public override ProblemCollection
	Check(Member member)
{
	Property p = member as Property;
	if (p == null) return null;
	if (p.GetPropertyInfo().CanWrite &&
		!p.GetPropertyInfo().CanRead
	{
		string[] s = { p.Name.Name };
		base.Problems.Add(new
			Problem(GetResolution(s)));
	}
	return base.Problems;
}
The custom rule description
When creating the Problem, the resolution for the rule violation is needed. This is where the BaseIntrospectionRule base class’s GetResolution() method comes into play. It obtains the resolution from the rule’s XML description file that was specified earlier in the MyCustomRuleBase class. The entire rule description is shown below with the resolution in red.<!-RuleData.xml ->
<Rules FriendlyName=”Simon’s rules”>
<Rule
TypeName=”WriteOnlyPropertyRule”
Category=”myrules.general”
CheckId=”MR0001”>
<Name>WriteOnlyProperty</Name>
<Description>
Ensures that a property is
not write-only.
</Description>
<Url/>
<Resolution>
The property {0} is write-only.
Consider making it read-write or
replace with a Set{0} method.
</Resolution>
<Email/>
<MessageLevel Certainty=”95”>
Warning
</MessageLevel>
<FixCategories>Breaking
</FixCategories>
<Owner />
</Rule>
</Rules>
Notice that the GetResolution() method plugs the offending property name into the resolution string before returning it.
Most of the elements and attributes shown above are mandatory. The Rule element’s TypeName attribute matches the type name passed to the custom rule class’s constructor and its CheckID attribute is a unique identifier for the rule. The MessageLevel element specifies whether a rule violation nominally reports as an error or a warning and its Certainty attribute estimates the probability that the reported issue is detected correctly. The FixCategories element reports whether the fix for the rule violation causes a breaking or non-breaking change.
It is important that the rule’s XML description file is an embedded resource within the assembly. To achieve this, go to the properties for the XML file and set its “Build Action” property to “Embedded Resource”.
Deploying and using the custom rule
The last thing to do is deploy the rule so that FxCop can find it. FxCop looks for assemblies containing rules in specific place, namely the Team Tools\Static Analysis Tools\FxCop\Rules subdirectory of the Visual Studio installation directory. Copy the assembly containing the rule to this location. If the rule is deployed correctly you should see it appear in the list of rules in the “Code Analysis” tab of the project properties. If you look closely at Figure 2 you will see that the list contains a “myrules” entry.Now introduce some code to analyse that contains a write-only property and you should see the custom rule violation occur.
Conclusion
So, in summary, it is a really good idea to analyse code for potential problems early in the development cycle and as often as possible. To encourage this, Microsoft has built a static code analyser into Visual Studio 2005 Professional edition and above which works on both managed and unmanaged code. It augments compile-time checking by suggesting code improvements based on a wide range of rules. It is also pretty customisable. You can be selective about which rules are included in the analysis, you can choose whether rule violations are reported as errors or warning and you can even extend the set of rules used for analysis to fit your organisation’s needs. The code analyser integrates well with MSBuild and VSTS which means that it can be used in almost any development scenario. If you care about enforcing code correctness and writing better quality code then you should use the code analyser as a matter of course.Simon Horrell is an author and instructor at DevelopMentor where he develops and delivers .NET courses. Lately he has been pouring all of his energy into Visual Studio Team System. He can be reached at: [email protected].
Useful Information
|
Comments